The road that Ronda did not need

Lluis Sanvicens • 10 July 2024

The road that Ronda did not need


It all happened very quickly. An email, a call, and a few weeks of intense study. Submission of the report, three interviews, two meetings, and a very good feeling.


There are jobs that are worth telling and reminiscing about. This is the story of one of them.


It was a morning like any other. A good coffee and a lot of enthusiasm ahead. Sitting in front of the PC, I saw an email that I hadn't opened, which happens when you have two email accounts. That's what crossed my mind—fix this one of these days… While my head was scolding me, my eyes were drawn to that email from an unknown sender that didn’t look like Spam. And indeed, it was a job proposal regarding a Sustainable Urban Mobility Plan that was in the public information period in Ronda (Málaga). It didn’t go into details, so curiosity and business sense made me respond quickly.


A few hours later, I had my first conversation with the Ronda and Comarca 2030 Association. Very kind and concerned people from Ronda who explained the job details to me. I listened carefully, noting that what they were looking for aligned with my values and ideals. So, I decided to accept the task, and without further ado, I got to work.


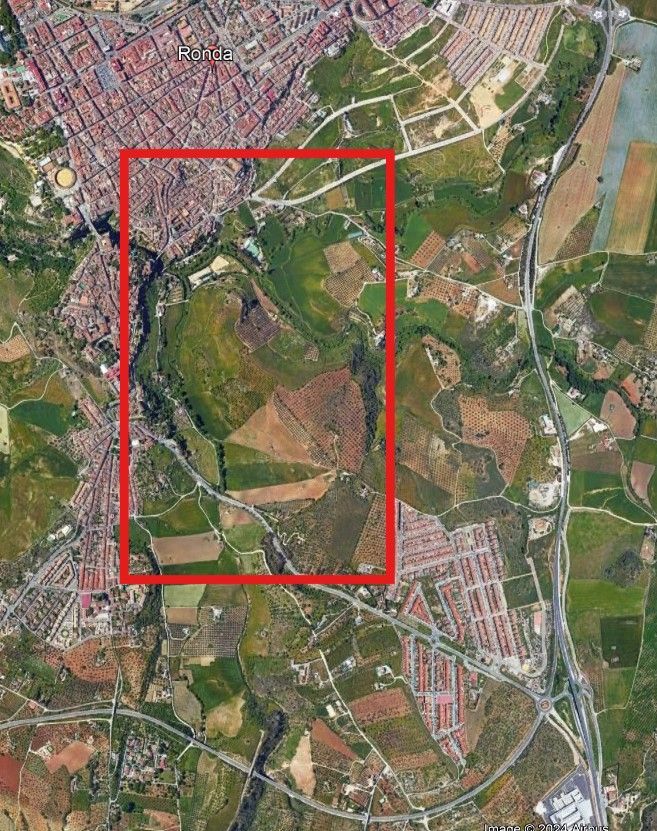
The job involved studying the SUMP of Ronda and an innovation in its General Urban Development Plan (PGOU), and how one justified the other. In plain words, the SUMP justified a new road that passed through meadows, streams, and rivers, in other words, through a rural area next to the city, with high landscape value, which is also classified as especially protected and has a high sentimental value for several groups in Ronda, as I later found out in the meetings I held.


First argument: A new road is projected as a result of the SUMP


The first idea that crossed my mind was, how does a SUMP justify the creation of a new road? Unheard of. We spent the entire 20th century building roads everywhere, justifying them by the increase in traffic demand. The SUMP should not go in that direction. On the contrary, SUMP were created as a tool to change citizens' habits, ultimately to promote sustainable mobility. I almost had my first argument. It needed to be dressed with technical and scientific evidence, and they existed. Increasing the road network causes the pernicious effect of induced demand. In other words, it facilitates the use of cars to the detriment of other modes. I was saddened because, as professionals, we must not lose the essence of what we are doing. I set myself the goal that it wouldn’t happen to me.


How the SUMP justified the construction of a new road Having finished the first argument, and after carefully reading the SUMP and the innovation of the PGOU of Ronda, I delved into the justification, and it was as follows. Several measures proposed in the SUMP focused on the semi-pedestrianization of the city center. The SUMP modeled the traffic, with various scenarios simulating what would happen with traffic restrictions in the city center. The result was that the ring road traffic increased considerably, going from a supposed current level of service D to E. With these results, the SUMP author suggested a new road to alleviate the ring road, which was modeled in a new scenario, and calculated a new volume and level of service for the ring road, returning it to the supposed level D. The author of the innovation picked up on the SUMP and justified the construction of the new road based on the modeling, scenarios, and conclusions of the SUMP.


Second argument: They used an assignment-only model, without modal distribution 


And so, without going deep into the simulation, I found that the model used was assignment-only. This model has certain limitations; one of the most important is that it doesn’t admit modal distribution. It is an easy model to implement as it is based on current trips, from which origin-destination matrices are determined, and finally, the movements are assigned to the road network. And I say road network because here we are only considering car trips. In raw terms, it means that all SUMP measures to promote sustainable mobility (leaving the car to walk or use public transport) have zero impact. This is where I developed my second argument: the SUMP author had not considered any change in the mode of movement in Ronda.


Level of Service as an excuse 


Now it was time to delve into how the calculations were made. A bit of reverse engineering was needed, as these documents usually don’t clearly explain where the results come from. Where to start? Sometimes one runs out of ideas. When that happens, you have to go back to the basics, which is not simple, but rather finding what the argument's foundation is. The basic thing here was that the level of service went from D to E. The level of service is a term that measures road congestion. It is the ratio of the volume of vehicles divided by the capacity of the road they pass through. For example, if 90 vehicles/hour pass through a lane, and the lane's capacity is 900 vehicles/hour, the ratio is 10%, and the level of service is A, which is the best. If, on the other hand, 900 cars pass, the ratio would be 100%, and the level of service becomes F, which is the worst. Between these are levels B, C, D, and E. So, it was necessary to focus on how the traffic volume and the ring road capacity were calculated.


Third Argument: Overestimated traffic volume 


My third argument was about the traffic volume considered. The demand model used was a daily model, and to calculate the peak hour, the SUMP author had considered 10% of the day concentrated in one hour. So, if there were 12,000 vehicles/day, the peak hour would have 1,200 vehicles/hour. This is a general case; the next question was whether such a case applied to Ronda. To find an answer, I analyzed the data for Ronda from the Ministry of Transport, Mobility, and Urban Agenda (MITMA). MITMA publishes aggregated data per hour for all trips over 500 meters. In Ronda, it was the case that traffic intensity remained quite constant from 8 am to 9 pm, so daily trips are evenly distributed over more than 12 hours. Here, the general case did not apply. The traffic volume in the SUMP was overestimated.


Fourth Argument: The ring road with the same capacity as an urban road 


Finally, it remained to analyze the capacity used to calculate the level of service. I realized that the author had used 900 vehicles/hour/lane, which is a correct capacity for urban roads, with intersections and traffic lights. However, the author used this same value for the ring road, which is designed for higher speeds, with grade-separated intersections, designed for duplication, without traffic lights… It couldn’t be. The ring road was considered an urban road! It seemed like a more than significant error. The construction of a new road was being justified because they had considered the same capacity per lane for the entire network modeled, without distinguishing between urban roads and the ring road. For clarity, standard capacity values range from 900 vehicles/hour/lane on urban roads to 2,200 for highways; the ring road should have had between 1,400 to 1,600 vehicles/hour/lane.


I recalculated the level of service, showing a current situation with a level of service B, consistent with what I saw in Ronda during my visit. Under the most adverse pedestrianization scenario, the level of service on the ring road went to level C.


I carried out several auxiliary checks, as I couldn’t believe it. I realized that the road network in Ronda was very resilient and could support the traffic from the pedestrianization of the center and much more.


I feel sorry for the SUMP drafting team, but I feel worse for a rural, landscape, and emotional environment that will lose its nature to become a road, due to a chain of misunderstandings based on significant errors, and a more than significant mistake.


Below you can see the images of the area where the road is intended to be built, the general view of the A-397 bypass, and the preliminary design of the road.
Movilidad Sostenible 2025: qué planes deben elaborar administraciones y empresas
by Lluis Sanvicens 16 October 2025
La Ley de Movilidad Sostenible 2025 define nuevos planes para administraciones y empresas, combinando obligaciones, incentivos y oportunidades de financiación.
Four-Step Transport Model Explained
by Lluis Sanvicens 16 September 2025
Learn how the four-step transport model works and why adding user experience is key to sustainable urban mobility and better transport planning.
Modelo de 4 etapas en movilidad urbana | Sanvi Consulting
by Lluis Sanvicens 16 September 2025
Introducción La planificación del transporte requiere anticipar cómo se desplazan las personas hoy y cómo lo harán en el futuro. Sin esta información, sería imposible diseñar infraestructuras, dimensionar servicios o evaluar políticas públicas. Entre los enfoques más extendidos, el modelo de 4 etapas se ha convertido en una metodología de referencia. Nació en Estados Unidos en los años cincuenta, en plena expansión del automóvil y las autopistas, y desde entonces se ha aplicado en todo el mundo. Su éxito radica en que ofrece una estructura clara para entender la movilidad y una base sólida para el análisis cuantitativo. En este artículo se explica en qué consiste, cómo funciona cada etapa y cuáles son sus limitaciones. 1. Generación de viajes La primera etapa responde a la pregunta: ¿cuántos viajes se realizan? Se trata de estimar la cantidad de desplazamientos producidos y atraídos en cada zona del área de estudio. Para ello se utilizan datos como: población residente, nivel de ingresos, tasa de motorización, número de empleos, atracción de centros comerciales, educativos, sanitarios o de ocio. Métodos habituales Modelos de regresión: se relacionan los viajes generados con variables socioeconómicas. Modelos por categorías: la población se agrupa en segmentos (edad, renta, ocupación) y se aplican tasas de viaje específicas. Ejemplo práctico: en una ciudad universitaria, los campus generan un gran número de viajes en horarios muy concretos; en una zona residencial, el origen de los viajes está más ligado a los desplazamientos al trabajo. 2. Distribución de viajes Una vez conocidos los viajes generados, surge la segunda pregunta: ¿hacia dónde se dirigen? Aquí se construyen las matrices origen–destino (O/D), que recogen cuántos viajes se producen entre cada par de zonas. Métodos más utilizados Modelo gravitacional: inspirado en la ley de la gravedad, supone que los viajes entre dos zonas aumentan con el tamaño de estas (población, empleos) y disminuyen con la distancia o el tiempo de viaje. Modelos de oportunidades: consideran la accesibilidad a oportunidades intermedias (ej. empleo disponible a lo largo de la ruta). Ejemplo: en una ciudad con varias áreas industriales, los viajes se distribuyen en función de la accesibilidad a los polígonos y de la distancia desde las zonas residenciales. 3. Reparto modal La tercera pregunta es: ¿qué modo de transporte eligen las personas? Esta etapa es crítica, porque de ella depende entender cómo se reparte la movilidad entre coche, transporte público, bicicleta, caminar, motocicleta u otros modos. La ecuación de Coste Generalizado (CG) El mecanismo clásico es la ecuación de Coste Generalizado, que transforma los factores que influyen en la elección en una unidad común (euros). Costes monetarios (out-of-pocket): billete, combustible, aparcamiento, peajes. Costes de tiempo: viaje, espera, acceso, transbordos, convertidos en euros mediante el valor del tiempo. Métodos de modelización Modelos logit multinomial (MNL): los más habituales, asignan una probabilidad a cada modo en función del coste generalizado. Modelos nested logit o probit: introducen mejoras cuando los modos tienen correlaciones (ej. distintos tipos de transporte público). 4. Asignación de viajes La última pregunta es: ¿qué rutas siguen los viajes en la red? Aquí se asignan los desplazamientos a la red viaria o de transporte público, considerando la congestión y el comportamiento de los usuarios. Principios básicos Equilibrio de Wardrop: cada viajero elige la ruta más ventajosa para sí mismo, y el sistema alcanza un equilibrio en el que ningún usuario puede mejorar su viaje cambiando unilateralmente de ruta. Asignación estocástica: introduce elementos aleatorios para representar la incertidumbre en la percepción de los tiempos de viaje. Ejemplo: en hora punta, la congestión en una vía principal puede hacer que algunos conductores elijan rutas alternativas, aunque más largas, para evitar atascos. Aplicaciones prácticas El modelo de 4 etapas se utiliza en múltiples ámbitos: Planes/Estudios de Movilidad. Ordenación Territorial y Urbanística. Evaluación de infraestructuras viarias y ferroviarios. Análisis de demanda de nuevos servicios de transporte público. Políticas de gestión de la demanda: peajes urbanos, zonas de bajas emisiones, tarificación del aparcamiento. Estudios de impacto ambiental y socioeconómico. Limitaciones y nuevas perspectivas Pese a su solidez, el modelo de 4 etapas tiene una limitación importante: no incorpora de manera directa la experiencia de usuario. Los factores que influyen en la elección modal van más allá de los euros y los minutos. Aspectos como: la regularidad y confiabilidad de los servicios, la comodidad de los vehículos, la seguridad percibida, la saturación en horas punta, o la facilidad de los transbordos, y condicionan en gran medida las decisiones de las personas. En Sanvi Consulting se ha trabajado para superar esta limitación. A través de encuestas específicas y formulación estadística, se han integrado estos intangibles en la ecuación de CG, bien como penalizaciones de tiempo equivalente o como variables perceptivas con peso estadístico. De este modo, se obtiene un modelo más realista, capaz de explicar no solo cuánto cuesta un viaje, sino cómo se percibe. Esto resulta esencial para entender qué puede llevar a una persona a dejar el coche y pasarse al transporte público o a caminar, y cómo diseñar políticas que impulsen ese cambio modal. Conclusión El modelo de 4 etapas sigue siendo el marco de referencia en la planificación de la movilidad. Su estructura clara lo convierte en una herramienta imprescindible para simular y anticipar desplazamientos. Sin embargo, la movilidad del futuro exige ir más allá: incorporar la experiencia de usuario en los modelos. Solo así se podrán diseñar sistemas de transporte más atractivos y políticas que fomenten una movilidad verdaderamente sostenible.
by Lluis Sanvicens 11 May 2025
Modelización del tráfico: una solución accesible para municipios de cualquier tamaño
by Lluis Sanvicens 19 March 2025
Evaluando la Ubicación de un Establecimiento Comercial con UrbanTimeTool: Precisión en la Movilidad Activa
by Lluis Sanvicens 2 March 2025
Modeling pedestrian and cyclist mobility: challenges and strategies. Learn how mobility models can be enhanced with sensor data and advanced analysis to optimize sustainable transportation.
by Lluis Sanvicens 2 March 2025
Modelización de la movilidad peatonal y ciclista: retos y estrategias. Descubre cómo los modelos de movilidad pueden mejorar con datos de sensores y análisis avanzados para optimizar el transporte sostenible.
Plan Estratégico de Accesibilidad Urbana PEAU
by Lluis Sanvicens 9 November 2024
Crear un Plan Estratégico de Accesibilidad Urbana (PEAU) es una tarea fundamental para los planificadores urbanos y los consultores de movilidad urbana. Este plan tiene como objetivo garantizar que los residentes de una ciudad puedan acceder de manera conveniente a servicios y lugares esenciales, independientemente de su edad, género o preferencias de movilidad. Un PEAU bien estructurado puede mejorar la calidad de vida de los habitantes de la ciudad. En este artículo, explicamos los siete pasos esenciales para establecer un PEAU, profundizando en cada etapa para una comprensión completa.
Settling a Strategic Urban Accessibility Plan: A Step-by-Step Guide
by Lluis Sanvicens 8 November 2024
Creating a Strategic Urban Accessibility Plan (SUAP) is a crucial undertaking for city planners and urban mobility consultants. This plan aims to ensure that a city's residents can access essential services and facilities conveniently, regardless of their age, gender, or mobility preferences. A well-structured SUAP can enhance the overall quality of life for the city's inhabitants. In this article, we will outline the seven essential steps for settling a SUAP, delving deeper into each stage for a comprehensive understanding.
Disruption Management and Service Reliability in Transit Service
by Lluis Sanvicens 2 November 2024
The delays resulting from incidents not only affect the reliability of the transit service but also have a direct link to customer satisfaction.
More posts